# NEW PACKAGES ------------------------------------------------------------

week9_1 <- c("scales", "patchwork", "htmltools",  "leafpop", "leaflet",
             "mapview", "usmapdata", "usmap", "mapcan", "cancensus",
             "tidycensus",  "geojsonsf", "tidygeocoder",
             "rnaturalearthdata", "rnaturalearth", "ggspatial",
             "terra", "sp", "sf", "gt", "colorspace")

install.packages(week9_1)Week 9
More ggplot2
Soci—269
Mapping with ggplot2—
October 27th
Reminders
The Cummings Lecture
Title
Something Between Us
The Everyday Walls of American Life, and How to Take Them Down
Description
Click to Expand or Close
Scroll to access the entire description.
In 2016, Anand Pandian was alarmed by Donald Trump’s harsh attacks on immigrants to the United States, the appeal of that politics of anger and fear. In the years that followed, he crisscrossed the country seeking out fellow Americans with markedly different social and political commitments, trying to understand the forces that have hardened our suspicions of others. The result is Something Between Us, a groundbreaking and ultimately hopeful exploration of the ruptures in our social fabric, and courageous efforts to rebuild a collective life beyond them. Through vivid encounters with Americans of many kinds, Pandian shares tools to think beyond the twists and turns of our bracing present.
Date and Time
Location
Reminders
Coding Assignment in
Coding Assignment Deadline
Your first coding assignment is due by 8:00 PM on Tuesday, November 4th.
Reminders
Coding Assignment in
Today’s Preliminaries
Today’s Packages
Launch RStudio and run the following code:
Give me a when all the packages have been installed.
Today’s Script File
Our Data
Our Data
Let’s Launch RStudio
Note
The rest of today’s session will take place in RStudio!
Extra: Map Projections
Wrapping Up Module II—
October 29th
Reminders
Coding Assignment in
Coding Assignment Deadline
Your first coding assignment is due by 8:00 PM on Tuesday, November 4th.
Reminders
Coding Assignment in
Today’s Preliminaries
Today’s Packages
Today’s Script File
Our Data
Let’s Launch RStudio
Note
The rest of today’s session will take place in RStudio!
Exercises
Reproduce This Plot
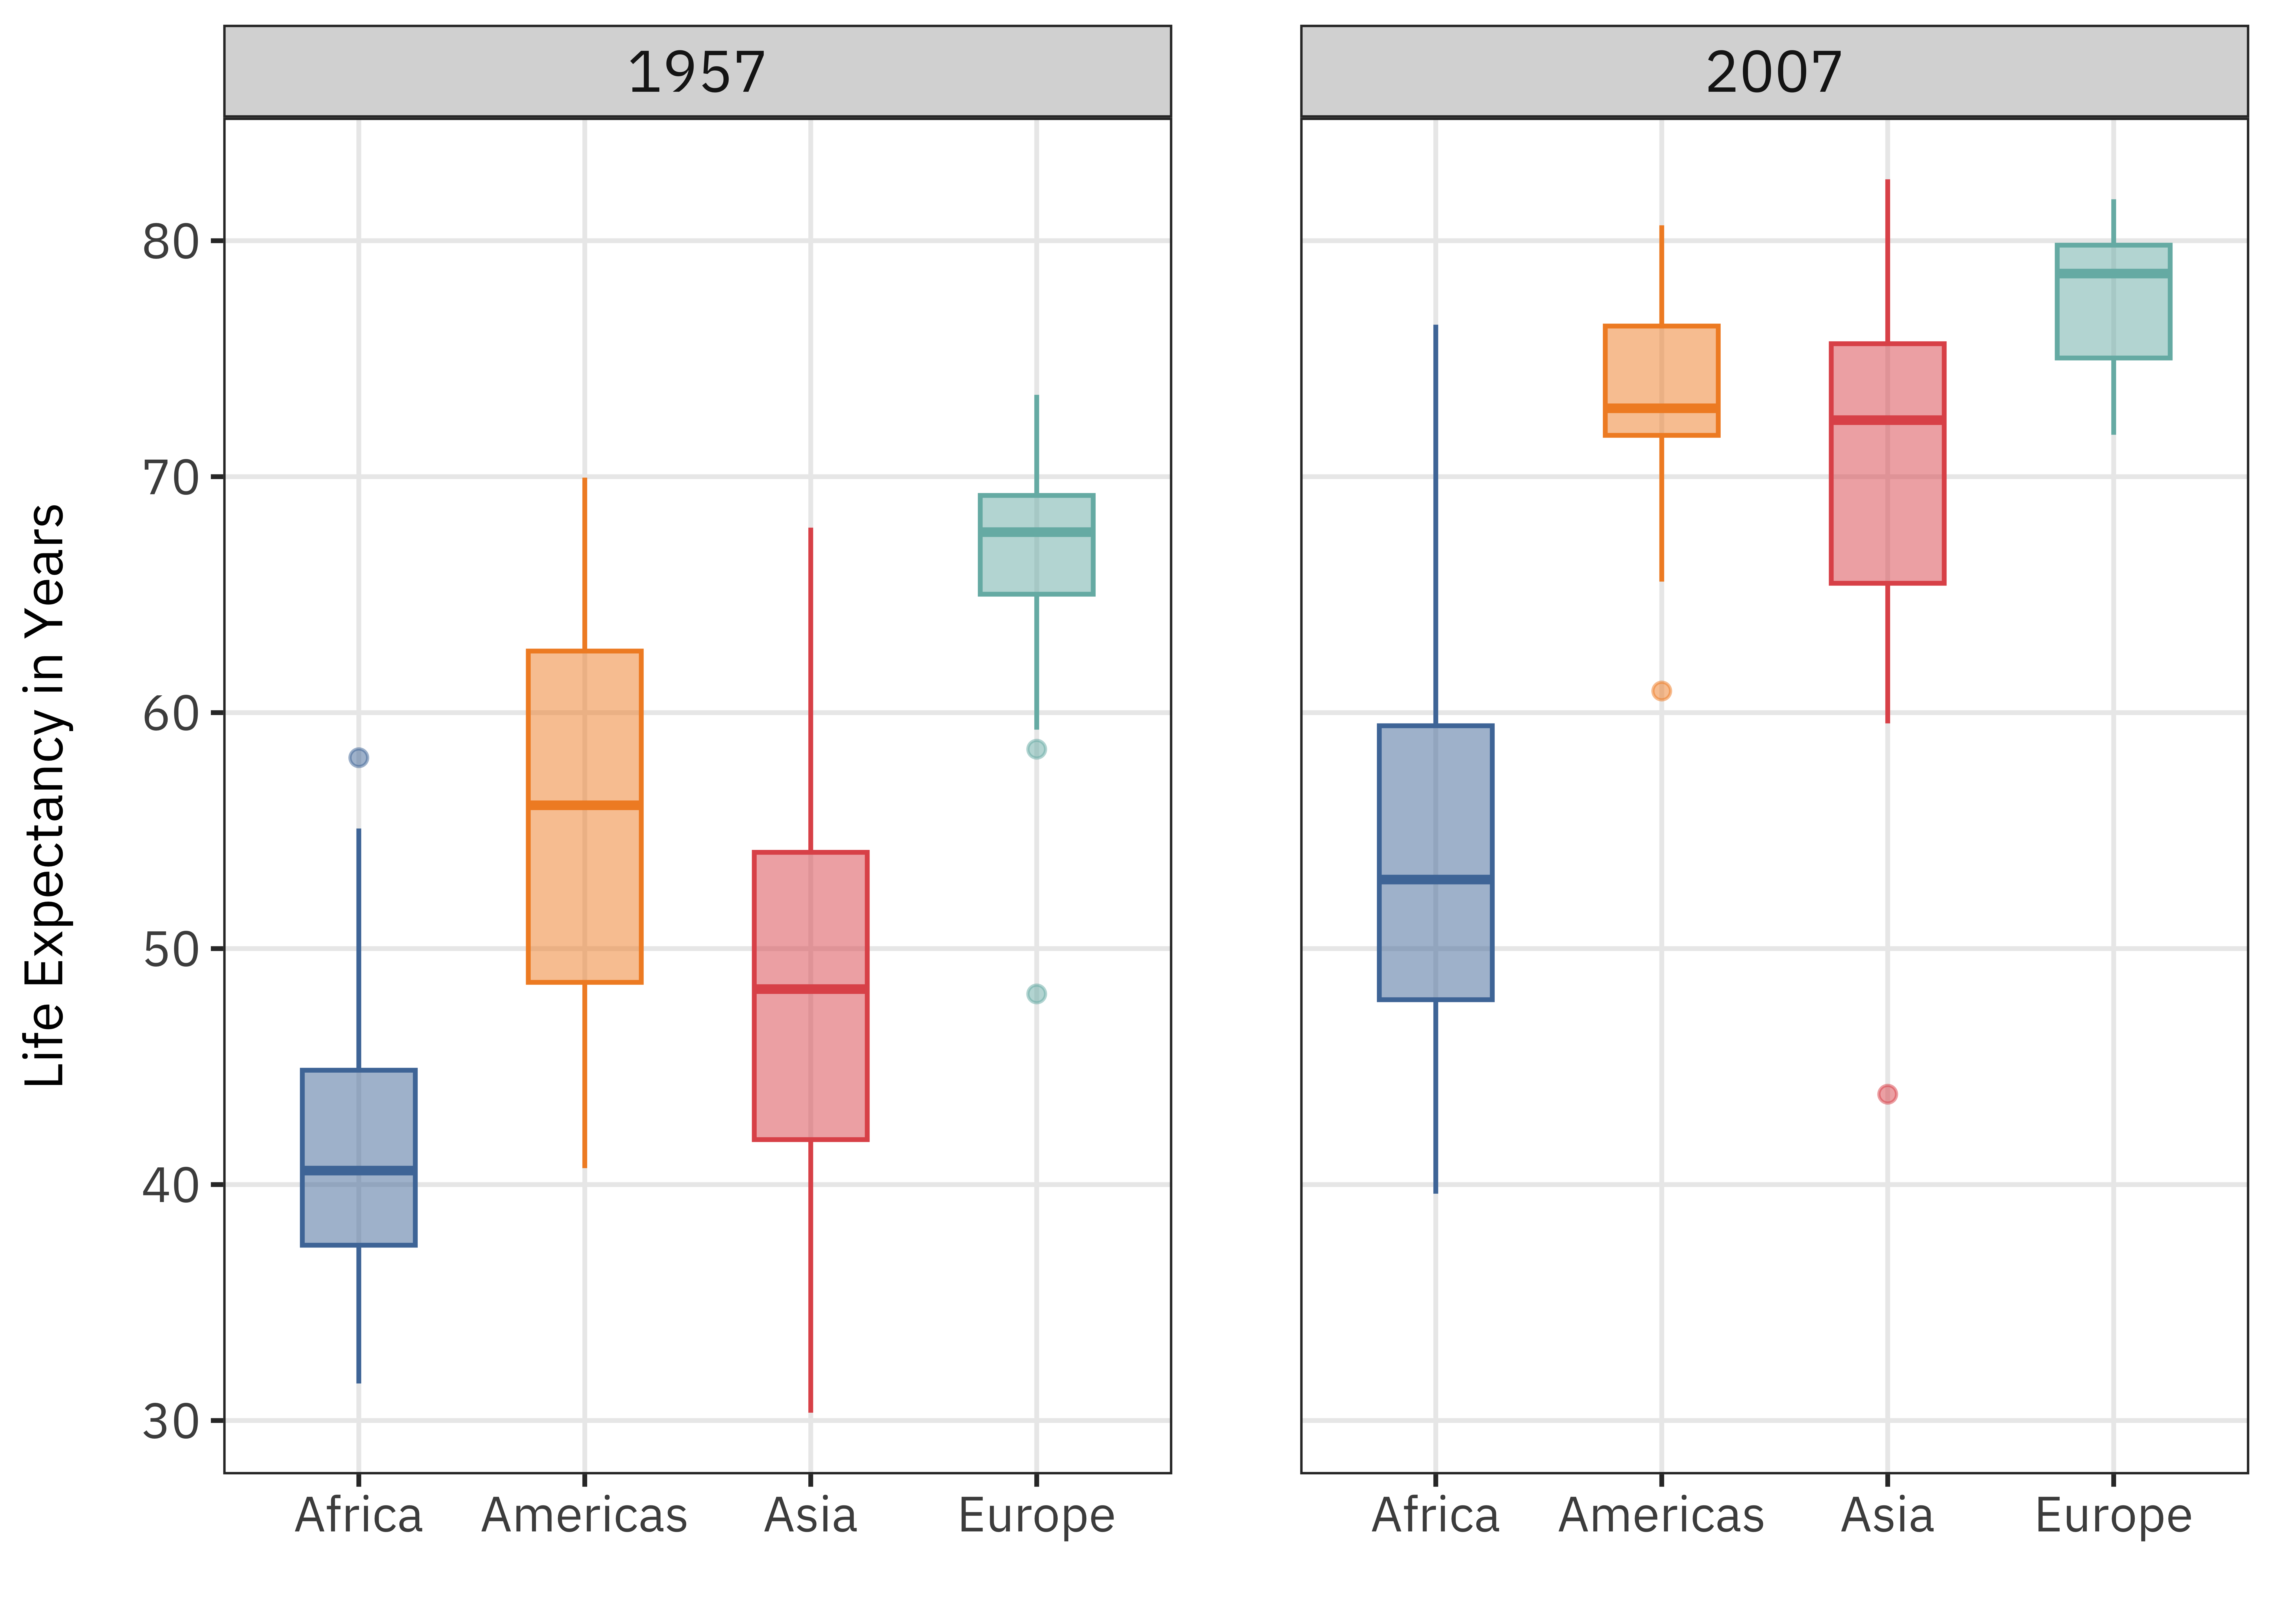
Reproduce the plot below using gapminder and the ggthemes package.
Please click the image to see a larger version of the plot.
Reproduce This Plot
Reproduce the plot below using the see package and geoms from ggdist.
Please click the image to see a larger version of the plot.
Reimagine These Plots
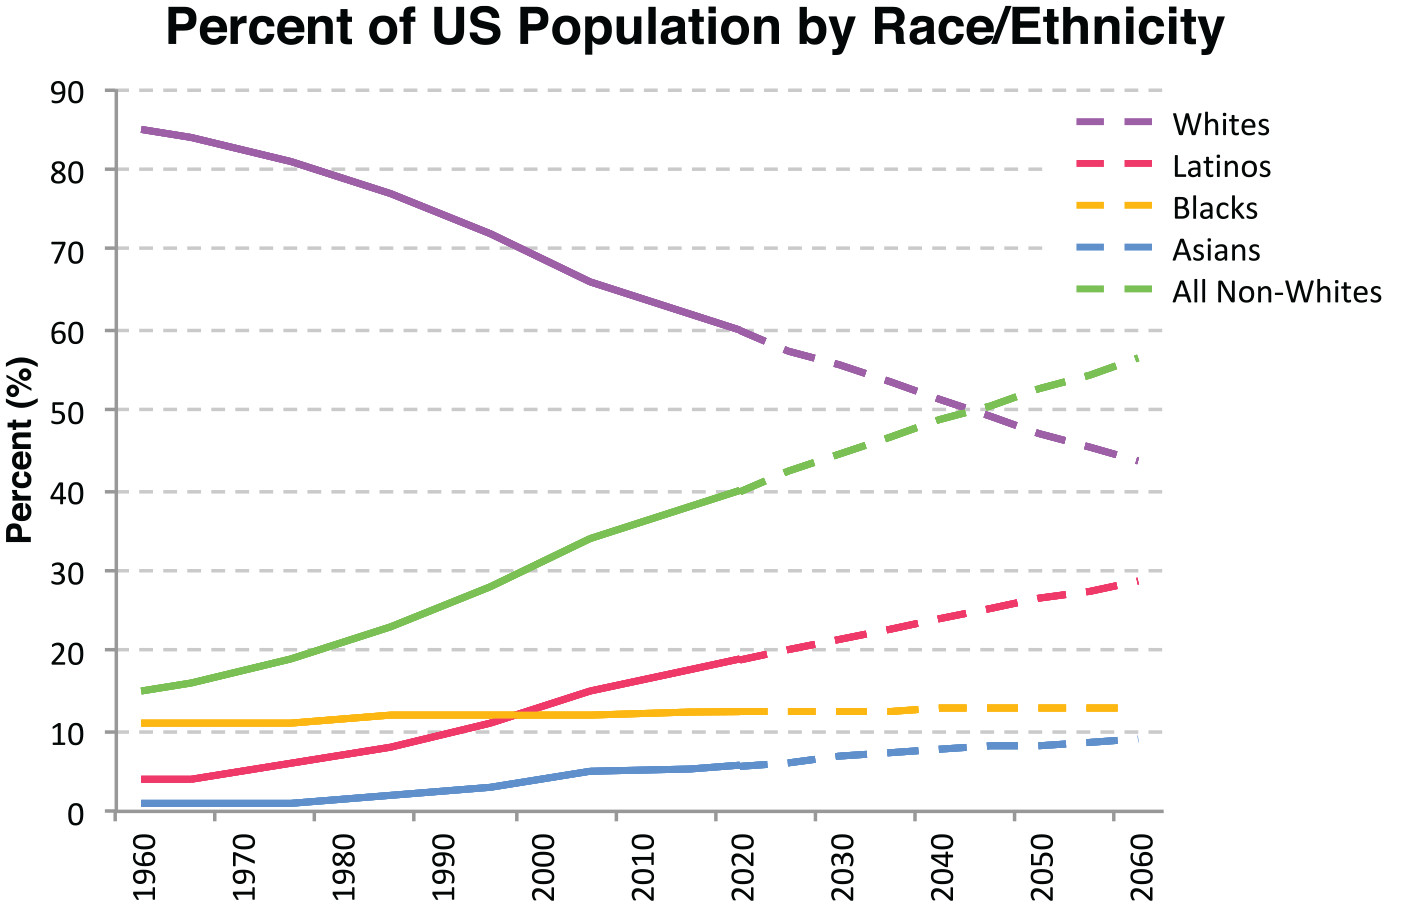
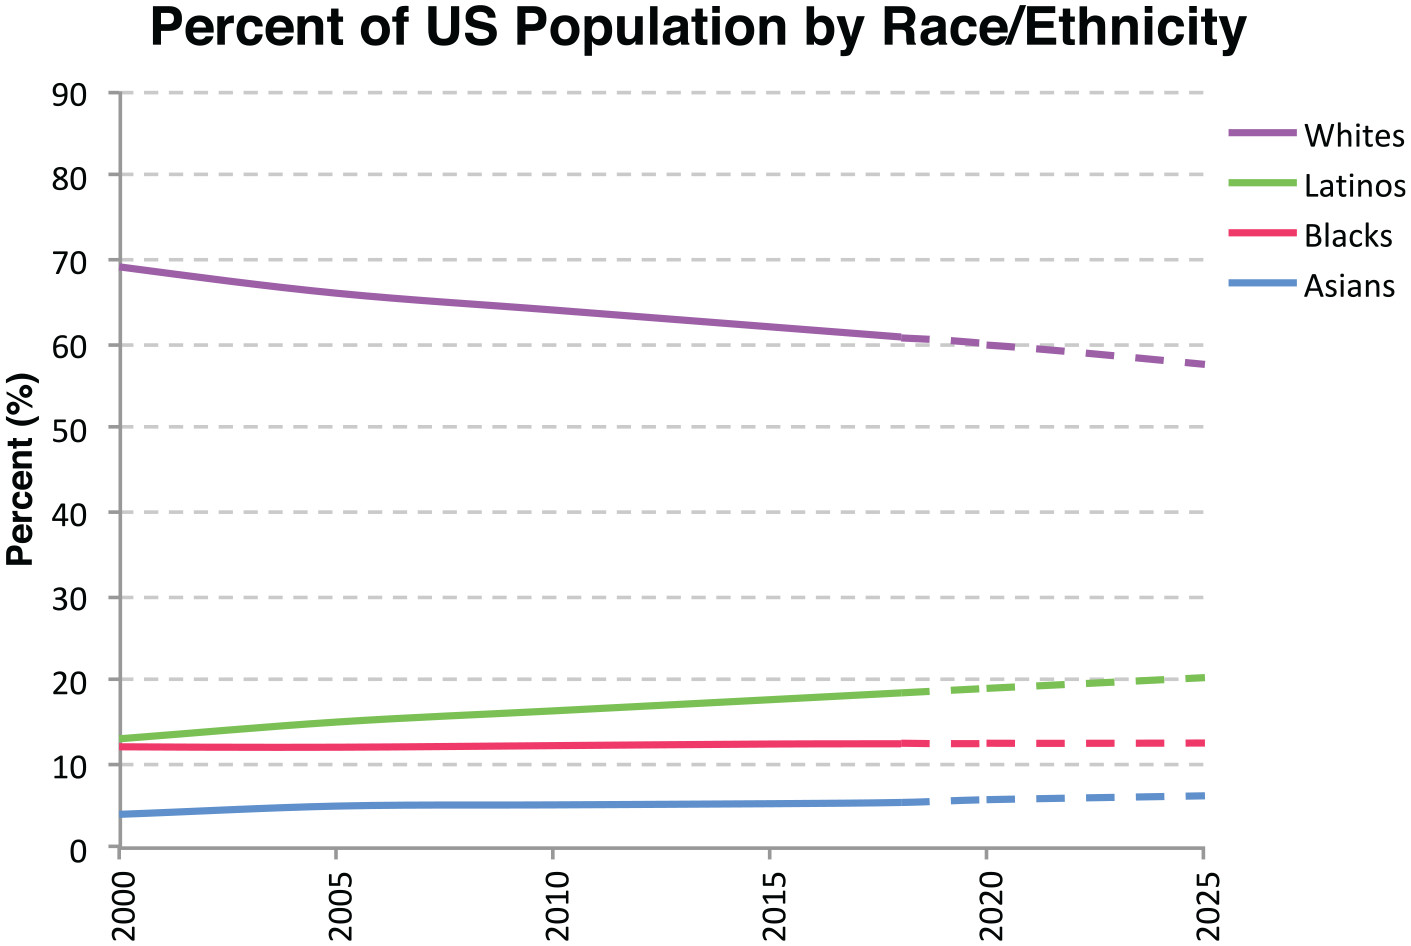
Use ggplot2 and data from the US Census Bureau to reimagine these plots from Abascal’s (2020) survey experiment.
You can click on either of these plots to launch a two-image gallery.
Enjoy the Weekend
References


